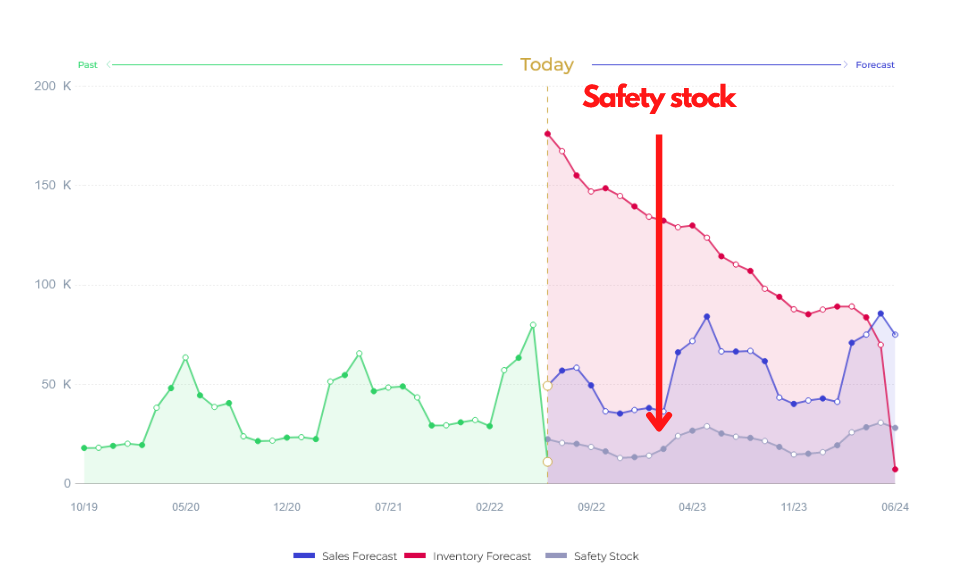
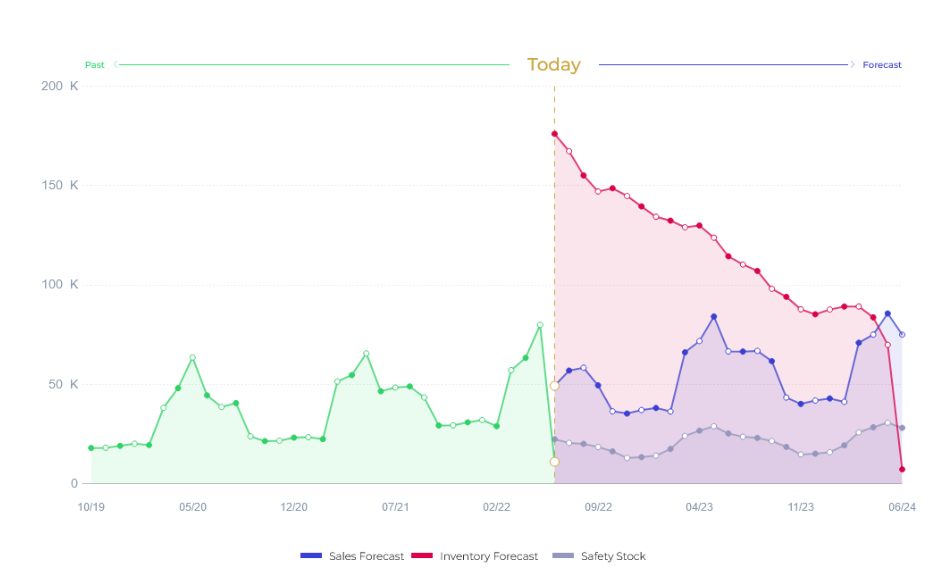
This graph shows your sales forecast, inventory forecast and a safety stock.
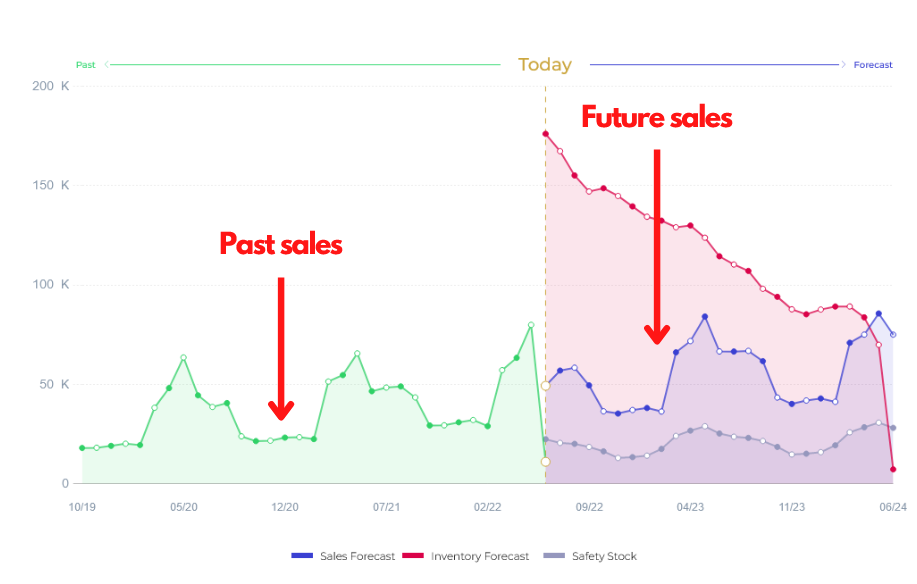
Before we start to forecast future sales, we prepare the historical data first. This is represented by a green part of the graph, and a blue one is the automatically created sales forecast for the next 24 months.
So, how do we calculate sales forecast?
First, we identify and clean off every outlier from the historical data.
Second, we detect every stockout in your history: calculate the duration, lost sales and give you recommendations on how to avoid them in future.
And finally, we detect every seasonal aspect, every pattern within your data from weak to strong seasonality.
Once we have the data cleaned we run over one hundred forecasting algorithms. These are a mixture of statistical methods, as well as AI, deep learning and neural networks. All together create a highly accurate sales forecast based on your data.
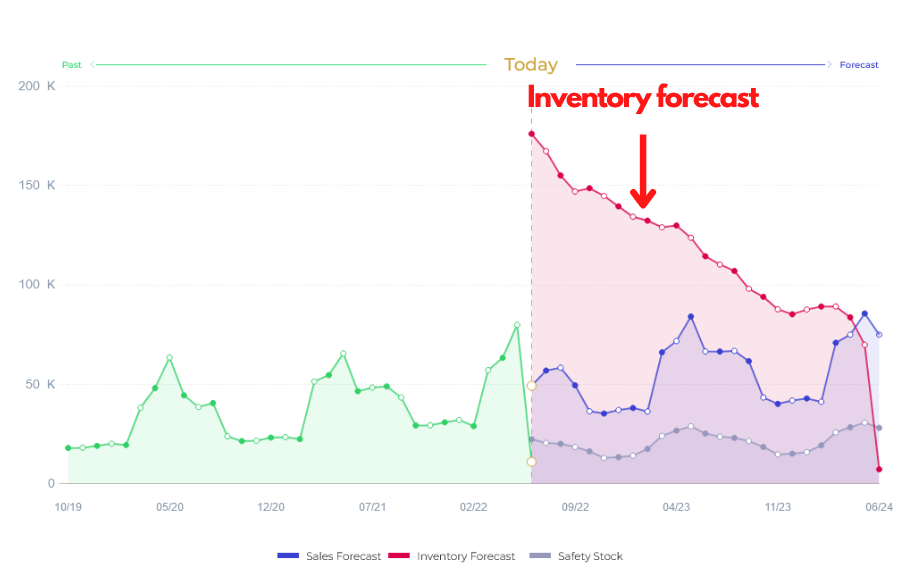
The red part of the graph is your Inventory Forecast.
By combining sales forecast, items data, purchase orders and on-hand and in-transit inventory, we can present you the 24 month inventory projection.
What are the main benefits of Inventory forecast for you?
You can speculate on the capacity of your warehouse or fulfillment center in the future.
You will see a complete picture of the future flows (sales and inventory). You can speculate and buy more inventory if you see free space in your warehouse
And finally: you can decrease your working capital by at least 25%!
The gray part of the graph is your Safety Stock
We prepare a projection of Safety stock as additional information for you and your decisions. Safety stock is a part of your Inventory that absorbs every uncertainty in delivery times/lead times of your suppliers and uncertainty in sales forecast accuracy. We can describe safety stock as a level of extra stock that is maintained to mitigate risk of stockouts caused by uncertainties in supply and demand.